
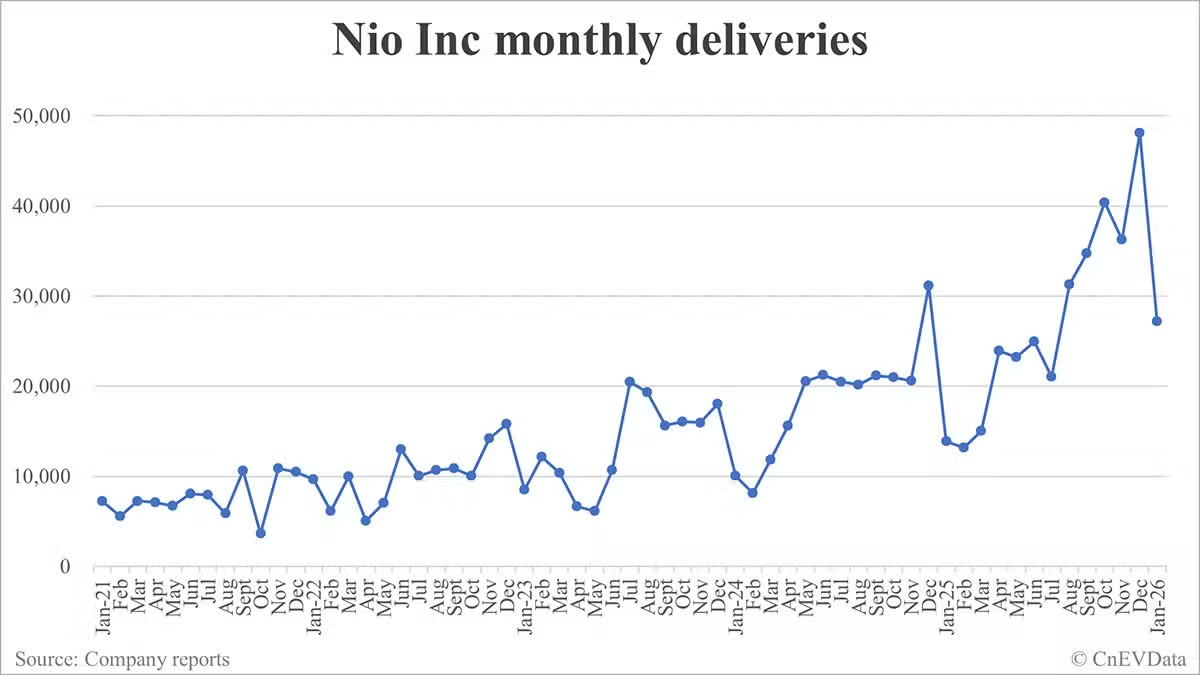
Nio Inc delivered 27,182 vehicles in January, marking a 96.08% year-on-year increase, though down 43.53% from December.
Nio Inc delivered 27,182 vehicles in January, marking a 96.08% year-on-year increase, though down 43.53% from December, according to data released today.
As of the end of January, Nio Inc's cumulative deliveries reached 1,024,774 units.
Nio monthly deliveries
| Month | Deliveries | YoY | MoM | Cumulative |
|---|---|---|---|---|
| 202602 | 20,797 | 57.65% | -23.49% | 1,045,571 |
| 202601 | 27,182 | 96.08% | -43.53% | 1,024,774 |
| 202512 | 48,135 | 54.59% | 32.69% | 997,592 |
| 202511 | 36,275 | 76.31% | -10.20% | 949,457 |
| 202510 | 40,397 | 92.59% | 16.25% | 913,182 |
| 202509 | 34,749 | 64.06% | 11.00% | 872,785 |
| 202508 | 31,305 | 55.16% | 48.95% | 838,036 |
| 202507 | 21,017 | 2.53% | -15.68% | 806,731 |
| 202506 | 24,925 | 17.52% | 7.29% | 785,714 |
| 202505 | 23,231 | 13.08% | -2.80% | 760,789 |
| 202504 | 23,900 | 53.01% | 58.92% | 737,558 |
| 202503 | 15,039 | 26.74% | 14.00% | 713,658 |
| 202502 | 13,192 | 62.22% | -4.84% | 698,619 |
| 202501 | 13,863 | 37.87% | -55.48% | 685,427 |
| 202412 | 31,138 | 72.87% | 51.34% | 671,564 |
| 202411 | 20,575 | 28.92% | -1.91% | 640,426 |
| 202410 | 20,976 | 30.50% | -0.97% | 619,851 |
| 202409 | 21,181 | 35.42% | 4.98% | 598,875 |
| 202408 | 20,176 | 4.38% | -1.57% | 577,694 |
| 202407 | 20,498 | 0.18% | -3.35% | 557,518 |
| 202406 | 21,209 | 98.09% | 3.24% | 537,020 |
| 202405 | 20,544 | 233.78% | 31.52% | 515,811 |
| 202404 | 15,620 | 134.60% | 31.64% | 495,267 |
| 202403 | 11,866 | 14.34% | 45.92% | 479,647 |
| 202402 | 8,132 | -33.11% | -19.12% | 467,781 |
| 202401 | 10,055 | 18.21% | -44.18% | 459,649 |
| 202312 | 18,012 | 13.89% | 12.86% | 449,594 |
| 202311 | 15,959 | 12.56% | -0.72% | 431,582 |
| 202310 | 16,074 | 59.80% | 2.77% | 415,623 |
| 202309 | 15,641 | 43.79% | -19.08% | 399,549 |
| 202308 | 19,329 | 81.03% | -5.54% | 383,908 |
| 202307 | 20,462 | 103.56% | 91.11% | 364,579 |
| 202306 | 10,707 | -17.39% | 73.96% | 344,117 |
| 202305 | 6,155 | -12.37% | -7.55% | 333,410 |
| 202304 | 6,658 | 31.22% | -35.85% | 327,255 |
| 202303 | 10,378 | 3.94% | -14.63% | 320,597 |
| 202302 | 12,157 | 98.29% | 42.92% | 310,219 |
| 202301 | 8,506 | -11.87% | -46.22% | 298,062 |
| 202212 | 15,815 | 50.78% | 11.55% | 289,556 |
| 202211 | 14,178 | 30.34% | 40.95% | 273,741 |
| 202210 | 10,059 | 174.31% | -7.53% | 259,563 |
| 202209 | 10,878 | 2.35% | 1.88% | 249,504 |
| 202208 | 10,677 | 81.58% | 6.22% | 238,626 |
| 202207 | 10,052 | 26.74% | -22.44% | 227,949 |
| 202206 | 12,961 | 60.35% | 84.52% | 217,897 |
| 202205 | 7,024 | 4.66% | 38.43% | 204,936 |
| 202204 | 5,074 | -28.56% | -49.18% | 197,912 |
| 202203 | 9,985 | 37.59% | 62.86% | 192,838 |
| 202202 | 6,131 | 9.91% | -36.48% | 182,853 |
| 202201 | 9,652 | 33.59% | -7.98% | 176,722 |
| 202112 | 10,489 | 49.69% | -3.58% | 167,070 |
| 202111 | 10,878 | 105.59% | 196.65% | 156,581 |
| 202110 | 3,667 | -27.46% | -65.50% | 145,703 |
| 202109 | 10,628 | 125.74% | 80.75% | 142,036 |
| 202108 | 5,880 | 48.30% | -25.86% | 131,408 |
| 202107 | 7,931 | 124.48% | -1.88% | 125,528 |
| 202106 | 8,083 | 116.12% | 20.44% | 117,597 |
| 202105 | 6,711 | 95.31% | -5.51% | 109,514 |
| 202104 | 7,102 | 125.10% | -2.14% | 102,803 |
| 202103 | 7,257 | 373.39% | 30.10% | 95,701 |
| 202102 | 5,578 | 688.97% | -22.80% | 88,444 |
| 202101 | 7,225 | 352.13% | 3.11% | 82,866 |
| 202012 | 7,007 | 32.43% | 75,641 | |
| 202011 | 5,291 | 4.67% | 68,634 | |
| 202010 | 5,055 | 7.37% | 63,343 | |
| 202009 | 4,708 | 18.74% | 58,288 | |
| 202008 | 3,965 | 12.23% | 53,580 | |
| 202007 | 3,533 | -5.53% | 49,615 | |
| 202006 | 3,740 | 8.85% | 46,082 | |
| 202005 | 3,436 | 8.91% | 42,342 | |
| 202004 | 3,155 | 105.81% | 38,906 | |
| 202003 | 1,533 | 116.83% | 35,751 | |
| 202002 | 707 | -55.76% | 34,218 | |
| 202001 | 1,598 | 33,511 |