This represents a 9.32% increase from the 63,238 units sold in the same period last year, but a 28.86% decrease from December's 97,171 units.

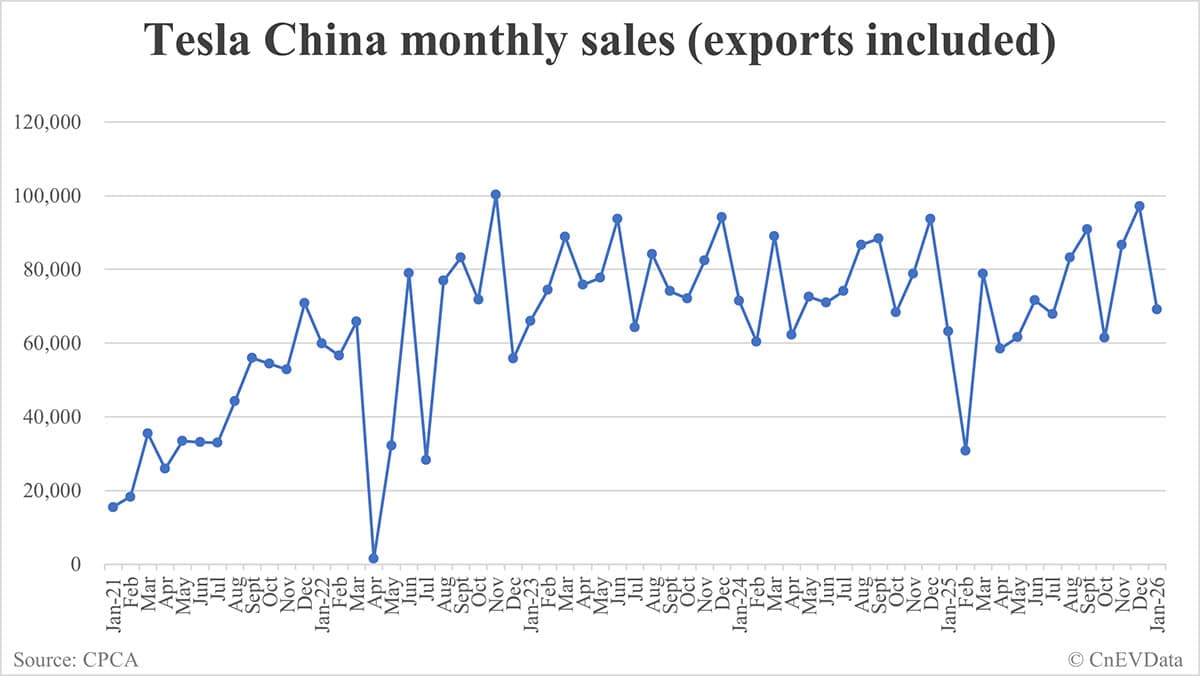
Tesla China wholesale sales in Jan: 69,129-CnEVData

Tesla China sold 69,129 vehicles in January, including those sold domestically and exported from China to overseas markets, according to data released today by the China Passenger Car Association (CPCA).

This represents a 9.32% increase from the 63,238 units sold in the same period last year, but a 28.86% decrease from the 97,171 units sold in December.

Tesla China monthly vehicle sales (exports included)

MonthTotalYoYMoM
20260385,6708.68%46.20%
20260258,59990.95%-15.23%
20260169,1299.32%-28.86%
20251297,1713.63%12.08%
20251186,7009.95%40.98%
20251061,497-9.93%-32.28%
20250990,8122.82%9.16%
20250883,192-4.04%22.55%
20250767,886-8.41%-5.19%
20250671,5990.83%16.12%
20250561,662-15.03%5.48%
20250458,459-5.96%-25.84%
20250378,828-11.49%156.87%
20250230,688-49.16%-51.47%
20250163,238-11.49%-32.56%
20241293,766-0.40%18.91%
20241178,856-4.34%15.49%
20241068,280-5.32%-22.69%
20240988,32119.24%1.87%
20240886,6973.02%16.97%
20240774,11715.29%4.38%
20240671,007-24.20%-2.16%
20240572,573-6.59%16.74%
20240462,167-18.03%-30.20%
20240389,0640.22%47.54%
20240260,365-18.87%-15.51%
20240171,4478.17%-24.10%
20231294,13968.72%14.20%
20231182,432-17.81%14.31%
20231072,1150.57%-2.64%
20230974,073-10.90%-11.98%
20230884,1599.35%30.92%
20230764,285127.82%-31.38%
20230693,68018.72%20.57%
20230577,695141.55%2.44%
20230475,8424916.01%-14.66%
20230388,86935.03%19.44%
20230274,40231.65%12.64%
20230166,05110.37%18.38%
20221255,796-21.24%-44.37%
202211100,29189.73%39.87%
20221071,70431.83%-13.75%
20220983,13548.44%8.02%
20220876,96573.88%172.76%
20220728,217-14.41%-64.24%
20220678,906137.99%145.32%
20220532,165-3.88%2027.31%
2022041,512-94.15%-97.70%
20220365,81485.51%16.45%
20220256,515208.52%-5.56%
20220159,845286.50%-15.53%
20211270,847197.63%34.03%
20211152,859144.67%-2.82%
20211054,391347.92%-2.88%
20210956,006394.36%26.53%
20210844,264275.12%34.26%
20210732,968198.60%-0.56%
20210633,155121.71%-0.92%
20210533,463201.60%29.48%
20210425,845611.00%-27.15%
20210335,478249.19%93.68%
20210218,318369.69%18.30%
20210115,484527.90%-34.95%
20201223,80410.18%
20201121,60477.91%
20201012,1437.19%
20200911,329-3.99%
20200811,8006.87%
20200711,041-26.17%
20200614,95434.78%
20200511,095205.23%
2020043,635-64.22%
20200310,160160.51%
2020023,90058.15%
2020012,466