China's automobile dealer inventory factor stood below the alert line of 1.50 in May, indicating that dealer inventory levels are within a reasonable range.

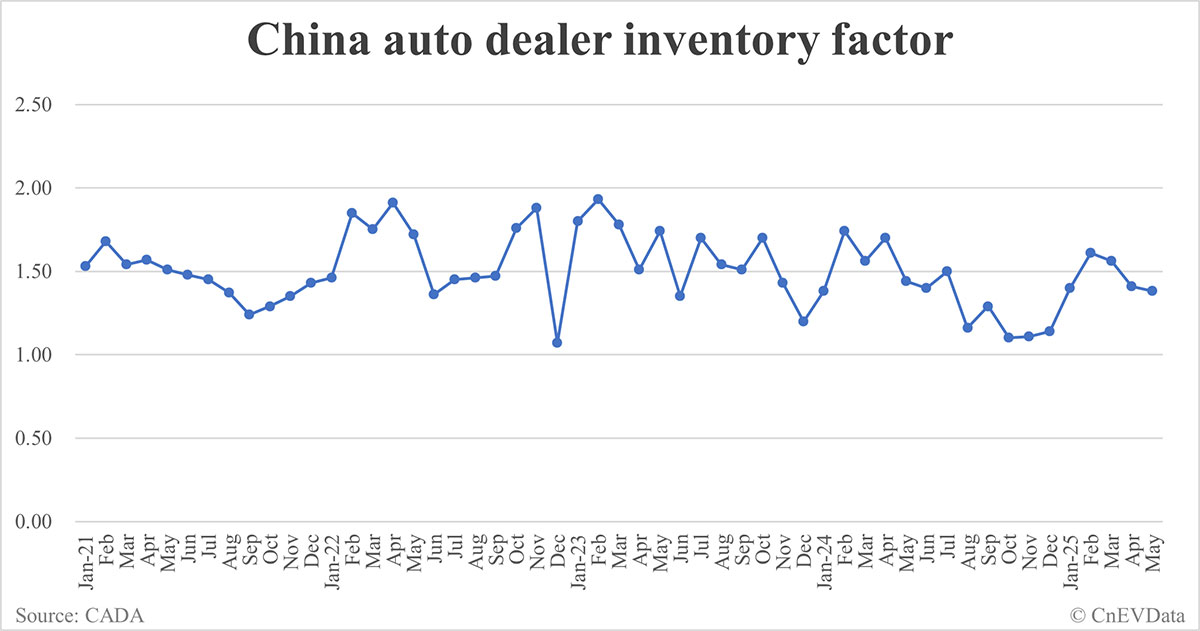
China auto dealer inventory factor falls to 1.38 in May-CnEVData

China's automobile dealer inventory factor stood at 1.38 in May, below the alert line of 1.50, indicating that dealer inventory levels are within a reasonable range, according to data released today by the China Automobile Dealers Association (CADA).

This represents a 4.17 percent decrease compared to the same period last year and a 2.13 percent decrease from April.

A note on the auto dealer inventory factor:

The CADA has been conducting regular inventory surveys of auto dealers since July 2010.

Inventory factor = inventory at the end of the period / current sales volume.

An inventory factor reading between 0.80 and 1.20 reflects that inventory is in a reasonable range.

An inventory factor greater than 1.50 reflects that inventory is at an alarming level and requires attention.

If the inventory factor is greater than 2.5, it reflects that the inventory is too high and the dealership is under significant pressure and risk.

China auto dealer inventory factor -- CADA

MonthInventory FactorMoMYoY
2026031.76-9.74%12.82%
2026021.9531.76%21.12%
2026011.4812.98%5.71%
2025121.31-16.56%14.91%
2025111.5734.19%41.44%
2025101.17-13.33%6.36%
2025091.353.05%4.65%
2025081.31-2.96%12.93%
2025071.35-4.93%-10.00%
2025061.422.90%1.43%
2025051.38-2.13%-4.17%
2025041.41-9.62%-17.06%
2025031.56-3.11%0.00%
2025021.6115.00%-7.47%
2025011.4022.81%1.45%
2024121.142.70%-5.00%
2024111.110.91%-22.38%
2024101.10-14.73%-35.29%
2024091.2911.21%-14.57%
2024081.16-22.67%-24.68%
2024071.507.14%-11.76%
2024061.40-2.78%3.70%
2024051.44-15.29%-17.24%
2024041.708.97%12.58%
2024031.56-10.34%-12.36%
2024021.7426.09%-9.84%
2024011.3815.00%-23.33%
2023121.20-16.08%12.15%
2023111.43-15.88%-23.94%
2023101.7012.58%-3.41%
2023091.51-1.95%2.72%
2023081.54-9.41%5.48%
2023071.7025.93%17.24%
2023061.35-22.41%-0.74%
2023051.7415.23%1.16%
202304 1.51 -15.17%-20.94%
202303 1.78 -7.77%1.71%
202302 1.93 7.22%4.32%
202301 1.80 68.22%23.29%
202212 1.07 -43.09%-25.17%
202211 1.88 6.82%39.26%
202210 1.76 19.73%36.43%
202209 1.47 0.68%18.55%
202208 1.46 0.69%6.57%
202207 1.45 6.62%0.00%
202206 1.36 -20.93%-8.11%
202205 1.72 -9.95%13.91%
202204 1.91 9.14%21.66%
202203 1.75 -5.41%13.64%
202202 1.85 26.71%10.12%
202201 1.46 2.10%-4.58%
202112 1.43 5.93%-20.56%
202111 1.35 4.65%-21.51%
202110 1.29 4.03%-17.83%
202109 1.24 -9.49%-20.51%
202108 1.37 -5.52%-8.67%
202107 1.45 -2.03%-24.08%
202106 1.48 -1.99%-14.94%
202105 1.51 -3.82%-2.58%
202104 1.57 1.95%-10.80%
202103 1.54 -8.33%-42.54%
202102 1.68 9.80%12.00%
202101 1.53 -15.00%2.68%
202012 1.80 4.65%
202011 1.72 9.55%
202010 1.57 0.64%
202009 1.56 4.00%
202008 1.50 -21.47%
202007 1.91 9.77%
202006 1.74 12.26%
202005 1.55 -11.93%
202004 1.76 -34.33%
202003 2.68 78.67%
202002 1.50 0.67%
202001 1.49

Dealer inventory factor of different brands -- CADA

MonthPremium & ImportJoint Venture BrandsLocal Brands
2026031.912.211.51
2026021.721.722.11
2026011.041.481.56
2025121.351.401.26
2025111.581.701.51
2025101.151.201.16
2025091.421.381.32
2025081.481.281.30
2025071.561.291.34
2025061.381.261.50
2025051.311.211.51
2025041.331.371.47
2025031.731.751.37
2025021.851.711.46
2025011.171.151.64
2024121.101.051.21
2024111.201.101.07
2024101.231.051.07
2024091.471.191.27
2024081.291.131.12
2024071.381.631.47
2024061.031.421.53
2024051.161.661.41
2024041.621.811.67
2024031.231.901.49
2024021.572.061.62
2024011.021.491.51
2023120.971.181.39
2023111.101.571.40
2023101.361.911.59
2023091.141.621.56
2023081.081.711.57
2023071.221.891.69
2023060.871.491.43
2023051.351.941.68
202304 0.97 1.68 1.60
202303 1.27 2.06 1.63
202302 1.70 2.15 1.74
202301 1.70 1.89 1.75
202212 1.03 1.04 1.22
202211 1.58 2.21 1.68
202210 1.58 1.88 1.65
202209 1.26 1.54 1.59
202208 1.14 1.53 1.57
202207 1.14 1.52 1.56
202206 1.15 1.40 1.42
202205 1.40 1.81 1.79
202204 1.66 1.99 1.95
202203 1.50 1.90 1.66
202202 1.60 2.01 1.74
202201 1.22 1.46 1.58
202112 1.19 1.41 1.54
202111 1.07 1.37 1.49
202110 0.99 1.31 1.47
202109 0.87 1.26 1.45
202108 1.11 1.34 1.50
202107 1.39 1.43 1.61
202106 1.40 1.46 1.59
202105 1.43 1.55 1.59
202104 1.50 1.58 1.73
202103 1.48 1.53 1.66
202102 1.65 1.76 1.71
202101 1.34 1.52 1.72
202012 1.39 1.91 2.08
202011 1.58 1.67 1.87
202010 1.31 1.57 1.71
202009 1.30 1.55 1.71
202008 1.20 1.57 1.68
202007 1.66 1.96 2.14
202006 1.35 1.77 20.70
202005 1.25 1.43 1.90
202004 1.33 1.83 2.31
202003 2.52 2.77 2.59
202002 12.98 16.21 13.38
202001 1.41 1.40 1.77